
Making Patent Citations Count: Statistical Tools for Valuing Innovation in Litigation and Licensing
Commentary
By Richard Eichmann* and Adam Rhoten[†]
Introduction
Disputes over intangible assets, such as patents, pose a distinct challenge: translating legal rights into economic terms. Courts and litigants routinely confront this challenge in litigation, including in patent infringement, trade secret misappropriation, breach of license, and bankruptcy proceedings.[1] Additionally, parties grapple with valuation in transactional contexts such as mergers and acquisitions, licensing negotiations, tax planning, financial reporting, and portfolio management.[2] However, the stakes in patent litigation are often particularly high: damages awards may hinge on how persuasively counsel can demonstrate the technological and economic contribution of the asserted invention. Consequently, patent valuation plays an essential role in patent litigation.
In patent litigation, parties frequently ask damages experts to assess the relative importance of technological features and to evaluate the comparability of asserted patents within a broader technological landscape. Courts, applying Federal Rule of Evidence 702 and related jurisprudence, increasingly scrutinize whether expert methodologies are grounded in reliable principles and methods.[3] The framework described in this Commentary provides an empirically grounded approach to evaluating patent significance within a citation network. By combining Patent Citation Analysis (PCA) with transformations appropriate for highly skewed citation distributions, this method provides a structured approach for distinguishing central technological contributions from peripheral references. For patent litigators and damages experts, such tools can help support more rigorous apportionment analyses and strengthen the evidentiary foundation of expert testimony.
Although intangible assets lack physical form, they often represent a substantial share of enterprise value.[4] Courts, juries, and arbiters, therefore, rely on structured valuation methods to determine the economic value of those rights. Because intangible assets comprise the majority of corporate value in many sectors, the ability to isolate and quantify the contribution of individual patents has become increasingly critical, not only for estimating damages and negotiating licenses, but also for shaping litigation strategy, settlement posture, and expert testimony.[5]
There are three generally accepted valuation approaches: the cost approach, the market approach, and the income approach.[6] The cost approach estimates value based on the expenditures required to recreate or replace the asset, adjusted for depreciation and obsolescence.[7] The market approach derives value from prices observed in comparable arm’s-length transactions involving similar assets.[8] The income approach, commonly applied to patents, measures value as the present value of the future economic benefits expected from the patented technology, such as incremental profits, cost savings, and royalty income.[9]
PCA complements existing methods by providing an empirical perspective, rather than by measuring historical cost or comparable transactions. It allows attorneys and experts to assess technological significance, competitive positioning, and likely economic contribution.[10] For litigators, citation analysis can strengthen arguments under the Georgia-Pacific factors, support apportionment positions, and reinforce comparability in license benchmarking.[11] These attributes, in turn, inform expectations about the future income the patented technology may generate and provide courts with a more objective basis for evaluating technological importance.[12]
In this context, forward citation analysis has emerged as one of the most practical and accessible tools for quantifying technological relevance.[13] A patent is a legally recognized claim on a novel and useful invention, granting its holder the right to exclude others from practicing that invention in exchange for public disclosure.[14] The challenge for experts, and for the attorneys who present their testimony, is translating that legal right into defensible economic terms.[15]
Patent valuation is an inherently complex task. Patents lack physical form, do not trade in transparent markets, and often have no direct benchmarks for cost or revenue contribution.[16] When the patented technology is embedded within a larger product or system, often alongside numerous other features and rights, isolating the standalone contribution of a particular patent requires structured economic analysis. Because direct observation is insufficient, value must be inferred. PCA provides one such inferential tool by examining how subsequent inventors and examiners have referenced the technology over time. Those forward citations serve as observable signals of technological influence and perceived importance within the broader innovative ecosystem.[17]
When filing a patent application, applicants must identify prior art,[18] including earlier patents and publications that form the technical foundation for the claimed invention.[19] These citations reflect, at a minimum, the applicant’s recognition (and often the patent examiner’s) that the cited references are relevant to assessing novelty and non-obviousness.[20] In some cases, a citation may signal substantial technological reliance; in others, it may reflect only peripheral relevance to the technology at issue, or a strategic disclosure decision.[21]
A single citation may not be materially significant in determining the overall relative importance of a given patent. By contrast, it is the cumulative pattern of forward citations over time, not the materiality of any individual reference, that can serve as a proxy for a patent’s visibility, foundational character, or perceived importance within its technological field.[22] That said, not all citations carry equal interpretive weight, a limitation addressed in more detail below. Some may be examiner-added, others applicant-driven, and their significance may vary depending on context, purpose, and citation practices within the field.[23]
Yet despite its intuitive appeal, raw citation data can be misleading. Patents vary not only in quality and subject matter, but also in age, classification, and visibility. Some patents receive more citations not because they are more influential, but because they occupy a more favorable position in time or technological space.[24] Structural factors—such as the patent’s intrinsic significance, the maturity of the technological field, prevailing examination practices, and the pace of innovation within the domain—also influence citation counts. For example, earlier-issued patents often accrue higher citation volumes simply by virtue of having existed longer, affording them more opportunities to be cited by subsequent filings.[25] Conversely, patents in emerging or highly specialized areas may receive fewer citations, even when they represent substantial technical or commercial advances, particularly if the innovation cycle is short or the downstream citation universe is limited. These temporal and field-specific effects can distort raw citation counts and thus must be carefully accounted for in any valuation analysis.
Moreover, the distribution of patent citations is far from uniform. A small subset of patents captures a disproportionately large share of total citations, while the vast majority receive few or none.[26] This creates a classic long-tailed pattern, with a dense concentration near zero and a tapering right tail that closely resembles a power law distribution, posing serious challenges to valuation professionals who must produce reliable, admissible, and economically sound assessments.[27]
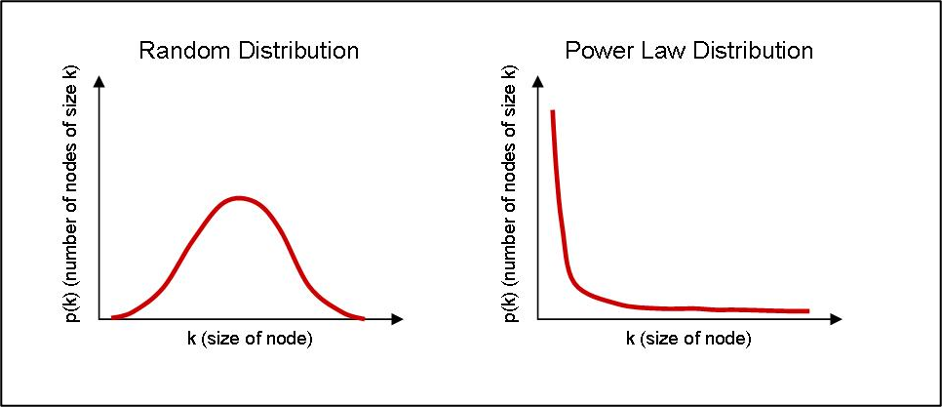
Figure 1. Power Law Distribution[28]
I. Understanding the Power Law Nature of Patent Citations
Power law distributions appear in many areas of economics, finance, and natural science.[29] In the context of intellectual property, the citation behavior of patents exemplifies this pattern with particular intensity. Most patents are never cited; of those that are, many receive only a handful of citations.[30] At the same time, a small minority of patents accumulate hundreds or even thousands of citations. These highly cited patents form the long tail of the distribution and account for a disproportionate share of variance in citation-based metrics.[31] This extreme concentration of attention and influence among a few outliers is not merely a statistical curiosity; it has profound implications for valuation, benchmarking, and the interpretation of technological significance.
The statistical structure underlying patent citation distributions can be formally described using a power law model. Mathematically, a power law distribution takes the form:

where P(x) is the probability of observing a value x, and ∝ is a positive constant greater than 1.[32] This formulation implies that the probability of very large values falls off slowly, a feature that distinguishes power law distributions from normal or exponential distributions.[33] In practical terms, this means that extreme values (e.g., the most-cited patents) are not just possible, they are common enough to skew average-based analysis.
This pattern, where most patents receive few or no citations and a small subset accumulates many, violates the assumptions underlying many standard statistical methods.[34] For example, the mean of a power law distribution may be unstable or undefined depending on the value of .[35] Even when the mean exists, it is not a representative measure of central tendency.[36] For valuation professionals accustomed to relying on averages, medians, or standard deviations, power law behavior necessitates a more nuanced approach.
A. Why Logarithmic Transformation Is Necessary
The first step in dealing with skewed citation data is to transform it.[37] Among the various transformations available, the natural logarithm stands out as both theoretically sound and widely accepted.[38] The natural logarithm, denoted and based on the constant e (~2.718), is particularly well-suited to datasets involving exponential growth, diffusion, and network effects, all of which characterize the way patent citations accumulate over time.[39]
Applying the natural logarithm to citation counts accomplishes several things simultaneously. It compresses extreme values, making the dataset more symmetrical and reducing the influence of outliers.[40] It renders the distribution closer to normal, thereby enabling the use of parametric statistical tools.[41] Moreover, natural logarithmic transformation preserves the ordinal ranking of patents, meaning that more highly cited patents still receive higher values after transformation. Consequently, the relative gaps between highly cited patents narrow to reflect diminishing marginal informational content.
From an economic standpoint, this logarithmic transformation is both accurate and desirable because it emphasizes relative differences over absolute ones.[42] The difference between 1 and 2 citations is meaningful. The difference between 101 and 102 is not. Logarithm transformation reflects this diminishing marginal impact. Formally, the transformation is written:
Log Score = ln (C+1)
where C is the raw forward citation count. The addition of 1 is critical, as the logarithm of zero citations is undefined.[43] This adjustment allows uncited patents to be retained in the analysis, acknowledging that a lack of forward citations does not imply a lack of value; it only indicates that the patent has not yet been cited, despite having satisfied the legal criteria for patentability.[44] By using ln(C +1), even uncited patents can be included in the analysis, receiving a transformed score of zero. This convention is standard practice in economic literature and reflects the reality that uncited patents are not necessarily irrelevant; they are simply not yet referenced within the citation network.[45]
B. Why “+1”? The Statistical and Practical Logic
The decision to use ln(C +1) rather than ln(C) is more than a mathematical fix. It has a clear practical justification. First, it preserves the completeness of the dataset. Excluding uncited patents would create a selection bias, particularly problematic if the valuation task involves comparing or apportioning among a full portfolio.[46] Second, the +1 adjustment creates a smooth transition between zero and low citation counts. It ensures that small citation differences among low-citation patents are treated proportionately, without introducing artificial discontinuities.[47]
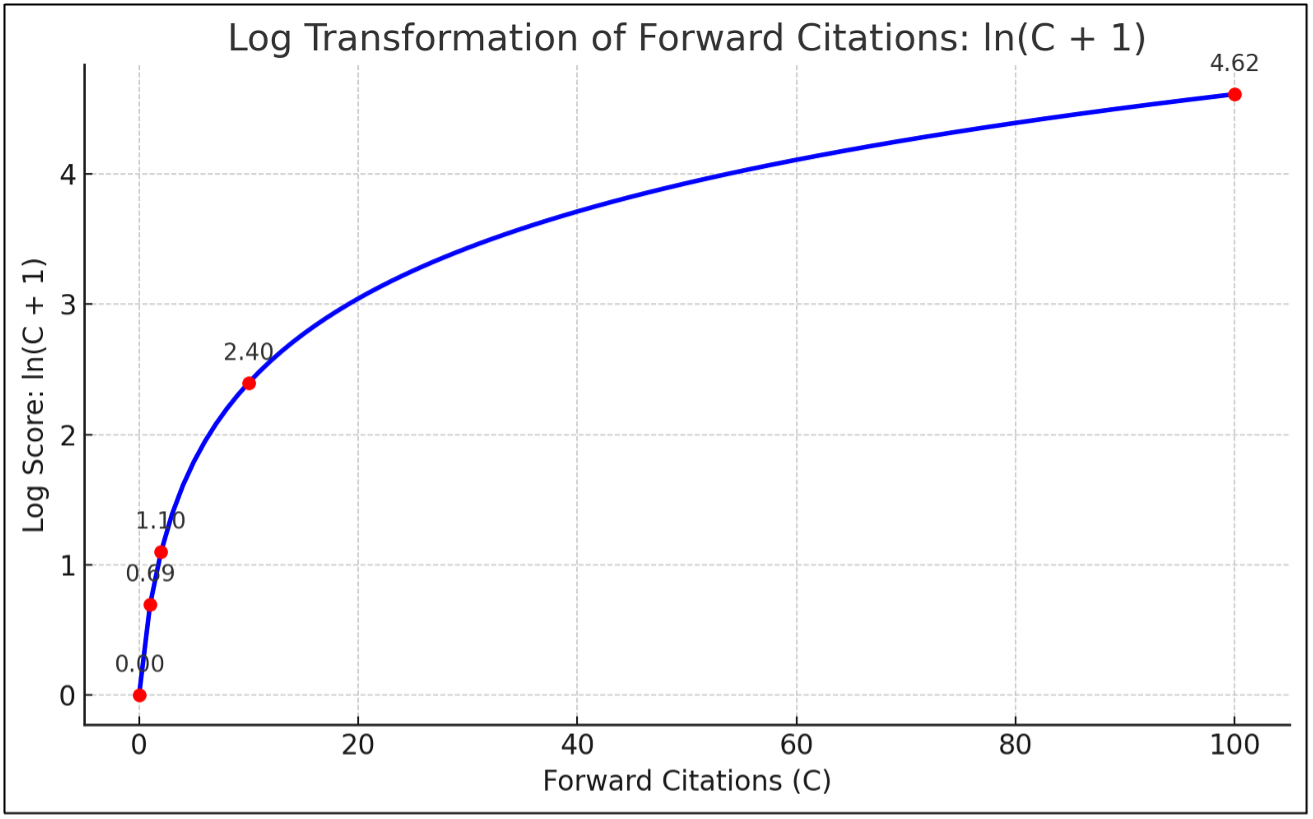
Figure 2. Logarithm Transformation of Forward Citations: ln(C +1)[48]
II. From Logarithm Scores to Z-Scores: Contextualizing Patent Influence
While logarithmic transformation helps normalize the scale of citation counts by reducing skewness and limiting the influence of extreme values, it does not, by itself, permit meaningful comparison across technologies, time periods, or filing cohorts. A patent in a high-citation field may still appear more influential than one in a low-citation field, even after logarithmic transformation, simply because citation norms differ across disciplines and eras. To enable valid comparisons across such heterogeneous contexts, further adjustment is required. Accordingly, we apply cohort-based standardization using z-scores, which situate an individual patent within the context of its peers by measuring how far above or below the cohort mean its citation score lies.[49] Formally, the z-score is given by:

where, X is the log-transformed citation count of the subject patent, µ is the mean of the cohort, and σ is the standard deviation.[50]
Analysts should carefully define cohorts because cohort selection directly shapes how courts and litigants interpret citation-based metrics..[51] Common cohort analysis approaches include grouping patents by: technology classification (e.g., CPC, IPC, or USPC codes), filing year or grant year, jurisdiction (e.g., USPTO vs. EPO), and entity size (e.g., large firm vs. small or individual filer).[52] The choice of cohort determines the practical meaning of a z-score and, in turn, the inferences that parties may reasonably draw from it.[53]
For example, a z-score of +1.0 in a narrow field such as semiconductor fabrication may signal greater economic significance than a z-score of +2.0 in a broader field like business methods, where citation inflation may be more common. Z-scores are especially useful for ranking, benchmarking, and apportionment.[54] They enable analysts to normalize valuation inputs across patents of different ages and technical domains, allowing for more accurate, apples-to-apples comparisons.
A. The Centering Shift and Its Rationale
While traditional z-scores are statistically centered around zero, there are practical and compelling reasons to apply a uniform upward shift, most commonly by adding 3.5.[55] This adjustment transforms all z-scores by the same constant, preserving relative rankings and differences while avoiding the interpretive difficulties associated with negative values.[56]
Statistically, a z-score measures how many standard deviations a value lies above or below the mean of its cohort.[57] In a normal distribution, approximately 99.9% of values fall between –3.5 and +3.5.[58] By adding 3.5 to every z-score, even the lowest-scoring patents, those in the extreme left tail, are shifted to zero or slightly above, ensuring non-negativity. This guarantees that nearly all adjusted scores are non-negative, which is especially useful in valuation contexts where scores are used as inputs into proportional models, such as apportionment weights or contribution factors.[59] For example, suppose the average number of citations per patent in a field is 10, with a standard deviation of 4. A patent with 18 citations would have: Z = ((18 – 10) / 4) = 2. This means the patent received two standard deviations more citations than the average, placing it well above the norm and likely in the top few percent of its cohort in terms of citation influence
Importantly, this adjustment does not alter the statistical integrity of the standardization. It is a linear transformation, not a rescaling, and therefore preserves the spacing, rank order, and interpretive meaning of the original standardization.[60] It simply recenters the distribution to improve clarity and usability in downstream applications. A patent with a z-score of +2.0 will still be exactly two standard deviations above the mean after the shift, now reflected as 5.5 rather than 2.0. The adjustment simply re-centers the distribution to facilitate interpretability.
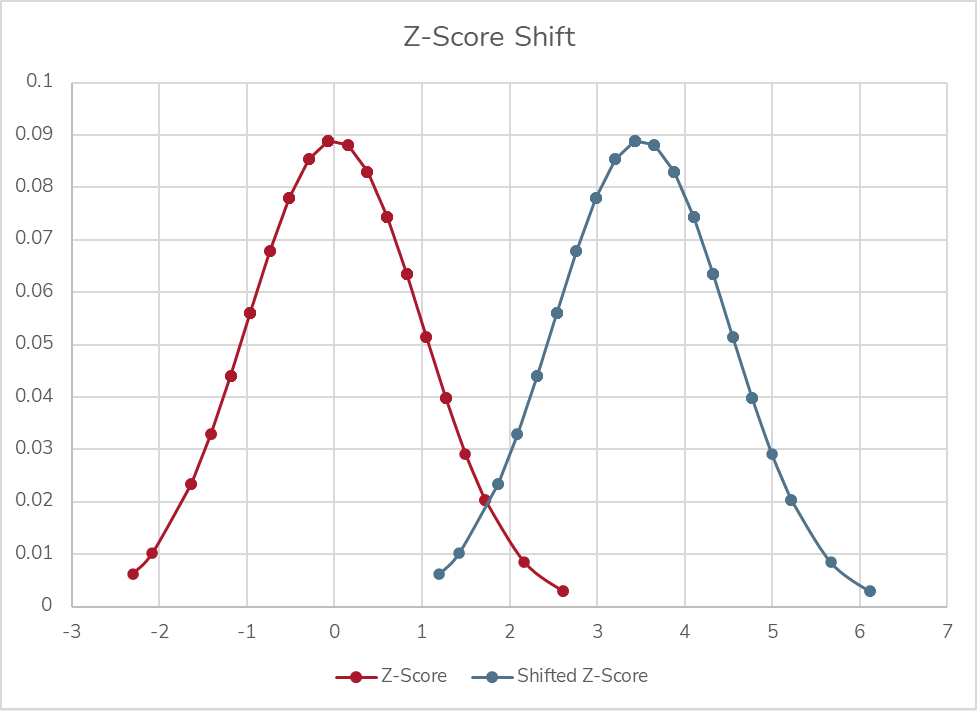
Figure 3: Z-Score Shift
There is also a communicative rationale. In litigation, licensing, or business decision-making, presenting a table of valuation weights or influence scores which includes negative numbers may obscure interpretation or undermine perceived credibility among non-technical stakeholders.[61] A score of –1.4, though statistically valid, may appear to convey disfavor or inferiority, rather than simply indicating below-average performance. By shifting the entire scale upward, experts can ensure that all values remain within a positive range, while still conveying relative strength and weakness.
The choice of 3.5, specifically, is deliberate. It aligns with the outer boundary of the normal distribution for all but the most extreme values, ensuring that the full cohort is retained without truncation. It also offers sufficient spread in the adjusted scores to preserve meaningful variation and ranking across patents. In essence, adding 3.5 to the z-score bridges the gap between statistical rigor and practical clarity, an adjustment that enhances interpretability in valuation modeling and strengthens the credibility of expert testimony.
III. Application to Expert Testimony and Georgia-Pacific Factors
The foundational framework for determining reasonable royalty damages in U.S. patent litigation originates from Georgia-Pacific Corp. v. United States Plywood Corp.[62] In that decision, the Southern District of New York articulated a non-exhaustive list of fifteen factors intended to guide courts and experts in determining reasonable royalty damages. The court designed these factors to approximate the royalty that would have resulted from a hypothetical negotiation between a willing licensor and licensee at the time infringement began.[63] The factors encompass licensing practices, the economic relationship between the parties, the characteristics of the patented technology, and the anticipated commercial benefits attributable to its use.[64]
Although the court developed the Georgia-Pacific factors in the context of patent damages, these factors remain a central analytical reference point for evaluating patent value, informing both litigation-based damages analyses and broader intellectual property valuation assessments.[65] When properly normalized, forward citation metrics can play a meaningful role in addressing several of the Georgia-Pacific factors.
Factor 9, which concerns “the utility and advantages of the patented invention over prior art,” and therefore focuses on the technological significance of the invention at the time of the hypothetical negotiation.[66] Citation analysis can bear directly on this inquiry. Forward citations represent contemporaneous references by subsequent inventors and examiners who deemed the patented technology sufficiently relevant to cite in later filings. While any single citation may not establish technological superiority, the cumulative citation pattern over time can serve as an objective indicator of how the technical community perceived the innovation was perceived. When benchmarked against similarly situated patents within the same field and filing cohort, elevated citation performance may suggest that the invention was viewed as foundational, influential, or enabling relative to existing alternatives. Properly normalized citation metrics, therefore, provide a structured and empirically grounded means of assessing the invention’s relative technological advantage, precisely the inquiry contemplated by factor 9.
Factor 13 involves apportioning the profit attributable to the patented invention.[67] Here, citation analysis offers a structured, data-driven method to estimate the relative technical contribution of the asserted patent, particularly in cases involving complex products that incorporate numerous components or intellectual property rights. When normalized and contextualized, z-scores and percentile rankings allow experts to assign proportionate value to each patent in a portfolio. For example, if Patent A has an adjusted z-score of 2.1 and Patent B has a score of 0.7, an expert may reasonably argue that Patent A accounts for a greater share of the royalty base, assuming all else is equal and the patents are comparably implemented.[68]
Factor 15, the catch-all “able to make a reasonable profit” royalty rate, also supports the use of citation analysis.[69] In a hypothetical negotiation, parties would likely consider real-world signals of technological importance. Citation evidence can help anchor royalty expectations to observable market behavior rather than litigation-driven assertions. This grounds the analysis in objective, temporally appropriate data that reflects how the market assessed the patent’s importance at the time infringement began.[70]
Citation data can also support comparability analyses in license benchmarking.[71] For instance, if the asserted patent ranks in the 95th percentile of its cohort, it may justify comparison to other high-value licensed patents similarly ranked.
Finally, citation metrics enhance the admissibility and defensibility of expert testimony under Fed. R. Evid. 702[72] and Daubert.[73] Because citation-based methods rely on publicly available data and statistically established techniques, they are more likely to survive challenges related to reliability, replicability, and methodological rigor. By contrast, raw citation counts, when used without adjustment for field, age, or skew, may be vulnerable to criticisms of bias, arbitrariness, or lack of relevance.
A. Real-World Example: Portfolio Apportionment Using Citation Metrics
Consider a litigation scenario in which a plaintiff asserts two patents (Patents A and E) related to mobile camera technology. The patents vary in technical contribution and perceived value, and both appear in a historical license agreement covering a broader portfolio. To avoid an even or arbitrary allocation of value, the expert applies citation-based methods to apportion value across the portfolio in a defensible, data-driven manner.
Here, the existing license agreement reflects a lump-sum payment of $1 million for a portfolio that includes Patents A and E among several other assets. Using the methodology described earlier in this paper, the expert transforms raw forward citation counts into logarithmic scores using ln(C+1), then standardizes those scores into z-scores based on a relevant cohort defined by IPC classification and grant year.[74] To improve interpretability and ensure that all values remain non-negative for proportional modeling, each z-score is shifted upward by 3.5.
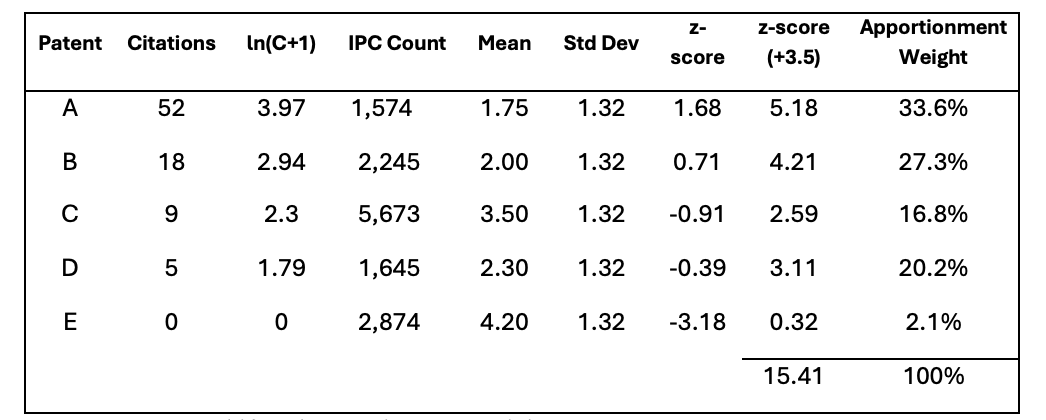
Figure 4. Z-Score Shift and Apportionment Weights
Based on the resulting adjusted scores, the expert calculates each patent’s relative citation influence. Suppose the analysis finds that Patent A represents 33.6% of the total citation weight and Patent E represents only 2.1%. The expert then attributes $336,000 of the $1 million license value to Patent A, and $21,000 to Patent E. This proportional allocation provides an empirically grounded estimate of each patent’s contribution to the overall transaction.
If additional context is available, such as the revenue or sales volume covered by the license, the expert may also use these allocated values to derive an implied royalty rate. For instance, if the $1 million license covers $20 million in licensed revenue, then the $336,000 and $21,000 attributed to Patent A and Patent E, respectively, imply royalty rates of 1.68 % and 0.105 % attributable to each patent alone, respectively.[75] In short, PCA equips experts with a methodologically rigorous framework for linking lump-sum portfolio licenses to individual patent values, enabling defensible apportionment in both settlement contexts and damages modeling.
B. Integrating Citation Analysis with Traditional Valuation Approaches
Citation-based metrics are not a substitute for traditional valuation methods; they are a complement. Experts can integrate log-transformed and z-score data with: income approaches, by adjusting discount rates or royalty rates based on patent influence; market approaches, by selecting and scaling comparables based on citation similarity; and cost approaches, by assessing whether high-value patents warrant higher development cost proxies. In all cases, this prescribed form of citation analysis adds structure, rigor, and empirical grounding to what might otherwise be a subjective process.
C. Legal and Practical Considerations
When presenting citation-based findings in litigation, clarity is essential. Experts should be prepared to explain the source and chronological currency of the citation data (e.g., USPTO, Derwent, Google Patents); how the cohort was defined and why it is relevant; the rationale for using ln(C+1); and for computing z-scores, as well as the limits of citation metrics (e.g., not all citations are equal; some may be examiner-added).
Courts will not expect attorneys or judges to understand the specific mathematics in full, but they will expect a clear explanation of what the numbers mean and why they matter. Well-prepared visuals, annotated tables, and transparent calculations go a long way in establishing credibility.
Conclusion
Forward citation analysis offers a powerful and accessible means of quantifying the technological relevance of patents. But to be truly useful in economic valuation, particularly in litigation, it must be applied with statistical rigor and methodological clarity. Raw citation counts, while intuitively appealing, suffer from heavy skewness, temporal bias, and interpretive ambiguity. Without adjustment, they risk misleading courts, counsel, and decision-makers alike.
This Commentary has presented a structured framework for overcoming those limitations. By applying a logarithmic transformation to compress the distribution of citation counts and then standardizing those values within carefully defined cohorts using z-scores, experts can meaningfully compare patents across technologies, filing years, and jurisdictions. The additional centering adjustment ensures that these standardized metrics can be incorporated into proportional models used for apportionment, benchmarking, and portfolio valuations.
For attorneys, the value of this framework is practical. Properly normalized citation metrics can strengthen arguments under Georgia-Pacific factors 9, 13, and 15, provide empirical support for apportionment positions, and reinforce comparability in license analyses. At a time when courts increasingly scrutinize expert methodology, citation-based analyses, when transparently applied, can help satisfy the reliability requirements of amended Federal Rule of Evidence 702 and the rigor emphasized in recent Federal Circuit decisions such as EcoFactor.[76] The 2023 amendment to Rule 702 makes clear that the proponent of expert testimony bears the burden of demonstrating methodological reliability.[77] Citation analysis, grounded in publicly available data and established statistical principles, offers a replicable and defensible analytical foundation.
Courts will not expect judges or juries to master the mathematics, but they will expect clarity: a coherent explanation of what the numbers represent, how they were derived, and why they matter to the hypothetical negotiation. Well-prepared visuals, transparent calculations, and careful cohort selection can materially enhance credibility. When properly deployed, citation analysis does more than quantify influence; it equips counsel with a principled, data-driven narrative about technological significance and economic contribution.
PCA is not a substitute for economic judgment; it is a tool that disciplines and sharpens it. Used responsibly, it enables experts and litigators to translate innovation into economically grounded, legally defensible value, ensuring that the role of technology in commercial success is measured with both precision and integrity.
Footnotes
[*] Managing Director, Secretariat, San Francisco, CA; MA Econ., B.A. Econ., B.A. Philosophy, University of Michigan, Ann Arbor, MI; Certified Valuation Analyst (CVA); Master Analyst of Financial Forensics in Commercial Litigation (MAFF), National Association of Certified Valuators and Analysts (NACVA).
[†] Director, Secretariat, San Francisco, CA; B.A. Econ., University of Oklahoma, Norman, OK; Vice Chair Monetization and Valuation, American Bar Association (ABA). Thanks to the staff of the Loyola Law Review for their comments and suggestions.
[1]See generally Dow Chem. Co. v. Mee Indus., Inc., 341 F.3d 1370, 1381–82 (Fed. Cir. 2003) (affirming reasonable royalty framework as method for translating patent rights into monetary damages); Lucent Techs., Inc. v. Gateway, Inc., 580 F.3d 1301, 1324–25 (Fed. Cir. 2009) (requiring economic proof sufficient to support royalty valuation of patented technology).
[2]See, e.g., Weinberger v. UOP, Inc., 457 A.2d 701, 713 (Del. 1983) (holding in merger appraisal proceedings, “all relevant factors” bearing on the value of the enterprise, including intangible assets, must be considered); DFC Global Corp. v. Muirfield Value Partners, 172 A.3d 346, 370–71 (Del. 2017) (discussing valuation methodologies in merger context, including discounted cash flow analysis); Lucent Techs., Inc., 580 F.3d at 1324–25 (recognizing that license agreements reflect negotiated economic valuation of patented technology); Veritas Software Corp. v. Comm’r, 133 T.C. 297, 316–18 (2009) (addressing valuation of intellectual property for transfer pricing purposes); Simon v. Comm’r, 103 T.C. 247, 253–54 (1994) (valuing intangible assets for federal tax purposes); United States v. Winstar Corp., 518 U.S. 839, 864–68, 868–70 (1996) (recognizing accounting treatment and valuation of intangible assets in financial reporting context); Hewitt v. Hewitt, 77 Ill. 2d 49, 55–58 (1979) (considering valuation of professional goodwill as an intangible asset).
[3] Federal Rule of Evidence 702 requires that expert testimony be based on sufficient facts or data and reliable principles and methods reliably applied. Fed. R. Evid. 702.
[4]See Ocean Tomo, Intangible Asset Market Value Study (2025) https://oceantomo.com/intangible-asset-market-value-study/ (reporting that intangible assets account for approximately 90 % of S&P 500 market capitalization in recent years, illustrating the dominance of non-physical capital in firm value) (available through industry sources); Feng Dong & John Doukas, The Role of Intangible Assets in Shaping Firm Value, 31 Eur. Fin. Mgmt. 1325, 1329 (2025) (developing an intangible-intensity metric and documenting its empirical relationship with revenue generation and market valuation); Halima Jibril, Annina Kaltenbrunner & Effie Kesidou, Financialization and Intangible Assets in Emerging Markets, 49 Cambridge J. Econ. 277, 293 (2025) (showing the economic significance of intangible asset investment decisions for long-run firm value).
[5]See generally Jonathan M. Barnett, Innovators, Firms, and Markets: The Organizational Logic of Intellectual Property (Oxford Univ. Press 2021).
[6]See Shannon P. Pratt & ASA Educational Foundation, Valuing a Business: The Analysis and Appraisal of Closely Held Companies 155–325 (6th ed. 2022) (describing and distinguishing the cost, market, and income approaches); Gregory K. Leonard & Lauren J. Stiroh, Economic Approaches to Intellectual Property Valuation, 10 J. Bus. Valuation & Econ. Loss Analysis 1, 3–6 (2015) (explaining that IP valuation generally proceeds under the cost, market, or income approaches).
[7]See Pratt & ASA Educational Foundation , supra note 6, at 155–325 (describing and distinguishing the cost, market, and income approaches).
[8]SeeId.
[9]See, e.g., Richard A. Brealey, Stewart C. Myers & Franklin Allen, Principles of Corporate Finance 102–10 (13th ed. 2020) (describing discounted cash flow valuation as the fundamental method for valuing income-producing assets); Anson Weston, Intellectual Property Valuation: A Primer for Identifying and Determining Value 9–13 (2013) (stating that the income approach values IP as the present value of expected future economic benefits, including incremental earnings and royalty income).
[10] Patent Citation Analysis is a quantitative analysis of forward citations made to patents, including earlier patents and related technical disclosures. By examining these citation patterns, researchers can evaluate how an invention builds on existing technology and how it fits within the broader innovation landscape. In practice, citation metrics are often used as objective indicators of technological significance and, in some contexts, economic importance.
[11]See Georgia-Pacific Corp. v. U.S. Plywood Corp., 318 F. Supp. 1116, 1120–21 (S.D.N.Y. 1970), modified on appeal, 446 F.2d 295 (2d Cir. 1971).
[12]See European Patent Office, What Are Good Indicators of Patent Value? (Noting that forward citations are often used as an indicator of patent value and impact), https://www.epo.org/en/service-support/faq/searching-patents/patent-management-and-valuation/what-are-good-indicators.
[13] Bronwyn H. Hall, Adam B. Jaffe & Manuel Trajtenberg, Market Value and Patent Citations, 36 RAND J. Econ. 16, 18–19 (2005).
[14]See, Edmund W. Kitch, The Nature and Function of the Patent System, 20 J. L. & Econ. 265, 266 (1977); Daniel F. Spulber, How Patents Provide the Foundation of the Market for Inventions, 11 J. Competition L. & Econ. 271, 279 (2015). A U.S. patent confers the right to exclude others from making, using, selling, offering for sale, or importing the invention as defined by the claims, and exists in exchange for public disclosure of that claimed innovation. Patent, Legal Info. Inst., https://www.law.cornell.edu/wex/patent (last visited Mar. 5, 2026) (exclusive right tied to the invention); WIPO, Frequently Asked Questions: Patents, https://www.wipo.int/en/web/patents/faq_patents (last visited Mar. 5, 2026); See also U.S. Pat. and Trademark Off., Patent Essentials, https://www.uspto.gov/patents/basics/essentials (last visited Mar. 5, 2026).
[15]See, e.g., Jody C. Bishop, The Challenge of Valuing Intellectual Property Assets, 1 Northwestern J. Tech. & Intell. Prop. 59, 62 (2003) (Noting that “the true value of intellectual property assets is generally difficult to measure”); Tim Karius, Intellectual Property and Intangible Assets: Alternative Valuation and Financing Approaches for the Knowledge Economy in Luxembourg, EIKV-Schriftenreihe zum Wissens- und Wertemanagement No. 3, 23 (2016) (explaining that valuation of IP and intellectual capital differs fundamentally from tangible asset valuation due to identification, market, and methodological challenges); Samer Ajour El Zein, Carolina Consolacion-Segura & Ruben Heurtas-Garcia, Understanding the Complexity of Intangible Assets, 82 TEST Eng'g & Mgmt. 16522, 16522 (2020) (observing that the non-physical and subjective nature of intangibles makes valuation more difficult and less standardized than valuation of physical assets).
[16]See, e.g., Hall, Jaffe & Trajtenberg, supra note 14 at 17–21 (noting that patents are intangible assets whose private value is difficult to observe directly and must be inferred from indirect indicators); Dietmar Harhoff et al., Citation Frequency and the Value of Patented Inventions, 81 Rev. Econ. & Stat. 511, 512–14 (1999) (explaining that patent value is highly skewed and not directly observable in market transactions); Carol Corrado, Charles Hulten & Daniel Sichel, Intangible Capital and U.S. Economic Growth, 94 Rev. Income & Wealth 661, 663–66 (2009) (discussing measurement difficulties associated with intangible assets due to lack of observable market prices).
[17]See Adam B. Jaffe, Manuel Trajtenberg & Rebecca Henderson, Geographic Localization of Knowledge Spillovers as Evidenced by Patent Citations, 108 Q. J. Econ. 577, 578–79 (1993) (explaining that patent citations identify prior inventions upon which later inventors rely and trace technological knowledge flows); Adam B. Jaffe & Manuel Trajtenberg, Patents, Citations, and Innovations: A Window on the Knowledge Economy 2–5 (MIT Press 2002) (describing citations as indicators of technological lineage and reliance on earlier patented innovations); see also 37 C.F.R. § 1.56 (2012) (duty to disclose information material to patentability).
[18] ‘Prior art’ refers to any publicly available information that predates a patent’s filing and is relevant to determining whether the claimed invention is novel or non-obvious. Prior art consists of earlier patents and publications that disclose the technological knowledge upon which later inventions build. See 35 U.S.C. § 102 (defining prior art as publicly available knowledge predating the claimed invention).
[19] U.S. Pat. and Trademark Off., Applying for Patents, https://www.uspto.gov/patents/basics/ (last visited Mar. 5, 2026); Graham v. John Deere Co., 383 U.S. 1, 33–34 (1966) (explaining that patentability requires evaluating the claimed invention “against the background of the prior art”); Jaffe, Trajtenberg & Henderson , supra note 18, at 578–79 (explaining that patent citations identify earlier inventions upon which subsequent inventors rely and reflect technological knowledge flows); Jaffe & Trajtenberg, supra note 18, at 2–5 (2002) (describing citations as documentation of technological lineage linking new inventions to prior patented innovations).
[20]Graham, 383 U.S. at 17; Jaffe & Trajtenberg, supra note 18, at 2–5 (explaining that patent citations document technological relevance and linkage between earlier and later inventions).
[21]See Jaffe, Trajtenberg & Henderson, supra note 18, at 578–80 (explaining that citations reflect varying degrees of technological connection); Hall, Jaffe & Trajtenberg, supra note 14, at 19–21 (recognizing heterogeneity in the informational content of individual patent citations).
[22] Numerous empirical studies have demonstrated that the number of forward citations received by a patent is correlated with its technological visibility and perceived importance within the relevant field. See Jaffe, Trajtenberg & Henderson, supra note 18, at 578–80 (explaining that heavily cited patents tend to represent influential technological contributions); Hall, Jaffe & Trajtenberg, supra note 14, at 16, 19–22 (finding that citation counts are positively associated with the technological and economic significance of patented inventions); Jaffe & Trajtenberg, supra note 18, at 3–6 (describing citation frequency as an indicator of patent importance and technological impact); Mark E. J. Newman, Power Laws, Pareto Distributions and Zipf’s Law, 46 Contemp. Physics 323, 323–26 (2005) (observing that citation distributions in innovation systems are highly skewed, with a small number of patents functioning as foundational references within their fields).
[23]See Jaffe, Trajtenberg & Henderson, supra note 18, at 578–80; Hall, Jaffe & Trajtenberg, supra note 14, at 19–21.
[24] Patent citation counts are affected not only by technological significance, but also by structural factors that influence the opportunity for citation, including the timing of patent issuance and the size and maturity of the relevant technological field. See Hall, Jaffe & Trajtenberg, supra note 14, at 19–21 (explaining that older patents accumulate more citations simply because they have had more time to be cited); Jaffe & Trajtenberg, supra note 18, at 63–66 (2002) (noting that citation frequency varies systematically across technology classes and over time due to differences in citation opportunity); Harhoff et al., supra note 17, at 514–15 (observing that citation counts must be interpreted in light of technological field characteristics and truncation effects); Newman, supra note 23, at 329–31 (describing how cumulative-advantage processes cause earlier or centrally positioned works to attract disproportionately higher citation counts).
[25]See, e.g., Bronwyn H. Hall, Adam B. Jaffe & Manuel Trajtenberg, The NBER Patent Citation Data File: Lessons, Insights and Methodological Tools, in Patents, Citations, and Innovations 403, 410–14 (Adam B. Jaffe & Manuel Trajtenberg eds., 2005) (explaining that citation counts are mechanically influenced by truncation and cohort effects, such that older patents have had more time to accumulate citations); Manuel Trajtenberg, A Penny for Your Quotes: Patent Citations and the Value of Innovations, 21 RAND J. Econ. 172, 175–77 (1990) (noting that citation-based measures require adjustment for time-related biases); Harhoff et al., supra note 17, at 513–14 (recognizing that citation counts are affected by the age of the patent and discussing the need for controls); see also Hall, Jaffe & Trajtenberg, supra note 14, at 20–23 (normalizing citation measures to account for cohort and time effects).
[26] Empirical research consistently demonstrates that patent citation counts are highly skewed rather than uniformly distributed, with a small number of patents receiving a disproportionately large share of total citations. See Hall, Jaffe & Trajtenberg, supra note 14, at 19–21 (documenting the highly skewed distribution of forward citations); Jaffe & Trajtenberg, supra note 14, 24–27 (2002) (showing that citation distributions exhibit strong right-skewness across technology classes); Newman, supra note 23, at 324–29 (explaining that citation systems generally follow power law or Pareto distributions characterized by extreme concentration); Harhoff et al., supra note 17, at 512–15 (finding that most patents receive few citations while a small fraction accounts for the majority of observed citation activity).
[27]See also, the Pareto principle. Pareto, Vilfredo, Manuel of Political Economy, (Ann S. Schwier & Alfred N. Page eds., Ann S. Schwier trans., Macmillan Press Ltd., 1971) (observing that approximately 80% of the land in Italy was owned by 20% of the population, and similar distributions appeared across other economic phenomena, leading to what has been generalized as the “80/20 rule.”)
[28] Mithra, Jitha, The Power Law, or Why Working Hard Is Not Enough, So It Goes (Feb. 1, 2015), https://jitha.me/power-law-working-hard-enough/ (providing an intuitive explanation of power law distributions and illustrating how outcomes in innovation-driven systems tend to be highly skewed, with a small number of participants or assets generating a disproportionate share of total value);Newman, supra note 23, at 323 (demonstrating that citation counts, technological impact, and innovation outputs frequently follow power law distributions in which a small subset of items accounts for a majority of observed economic significance);
[29] Power law distributions have been documented across a wide range of economic, financial, and natural systems, including income and wealth distributions, firm size, city populations, financial returns, and scientific citation networks. See Vilfredo Pareto, Cours D’Économie Politique (1896) (identifying the Pareto distribution in income and wealth); Xavier Gabaix, Power Laws in Economics and Finance, 43 Ann. Rev. Econ. 259, 259–62 (2009) (surveying empirical evidence of power law behavior across macroeconomic, firm-level, and financial phenomena); Newman, supra note 23, at 323–26 (reviewing the prevalence of power law distributions in economics, physics, biology, and information networks); Paul Gabaix et al., A Theory of Power-Law Distributions in Financial Market Fluctuations, 423 Nature 267, 267 (2003) (demonstrating power law behavior in financial markets).
[30]See, e.g., Harhoff et al., supra note 15, at 512–14 (documenting the highly skewed distribution of patent citations, with a substantial fraction of patents receiving no citations within standard observation windows); Hall et al., supra note 12, at 20–23 (showing that forward citation distributions are extremely skewed and include a large mass of uncited patents); Jaffe & Trajtenberg, supra note 18, at 34–38 (describing the heavy-tailed nature of citation distributions and the prevalence of zero-citation patents, particularly in early years after issuance).
[31] Harhoff et al., supra note 17, at 512–15 (finding that citation counts are heavily right-skewed and that a few patents account for a disproportionate share of total citations).
[32] Newman, supra note 23, at 324–27 (defining power law distributions as probability functions P(x) ∝ x -∝); Aaron Clauset, Cosma Rohilla Shalizi & Mark E. J. Newman, Power-Law Distributions in Empirical Data, 51 SIAM Rev. 661, 662–65 (2009).
[33] A defining characteristic of power law distributions is their heavy-tailed nature: the probability of observing very large values decays polynomially rather than exponentially, causing extreme outcomes to occur far more frequently than under normal or exponential distributions. See Newman, supra note 23, at 324–27 (explaining that power law tails “fall off” more slowly than exponential or Gaussian distributions); Clauset, Shalizi & Newman, supra note 33, at 662–64 (describing heavy-tailed behavior and contrasting polynomial decay with exponential decay); Gabaix, supra note 30, at 160–62 (noting that power law distributions imply a non-negligible probability of extreme observations relative to thin-tailed distributions).
[34] The structure of patent citation distributions, characterized by many observations with few or no citations and a small subset with extremely large counts, violates key assumptions underlying many standard statistical techniques, including normality, homoscedasticity, and finite variance. See Newman, supra note 23, at 324–29 (explaining that power law distributions exhibit heavy tails and stable characteristics common to other models); Clauset, Shalizi & Newman, supra note 33, at 662–66 (discussing why standard statistical estimators perform poorly under heavy-tailed distributions); Gabaix, supra note 30, at 160–63 (noting that power law behavior undermines conventional statistical inference methods that assume thin-tailed distributions); Hall, Jaffe & Trajtenberg, supra note 14, at 19–21 (documenting the extreme skewness of patent citation data and cautioning against naive statistical interpretation).
[35] By “unstable” we mean that the sample mean can fluctuate dramatically with the addition of a small number of extreme observations, rendering it highly sensitive to outliers and therefore unreliable as a measure of central tendency. Even when the mean formally exists, it may not be representative of the typical observation in the distribution.
[36] In power law distributions, statistical moments such as the mean and variance may be undefined or unstable depending on the value of the scaling exponent. Moreover, even when finite, the mean is typically not representative of central tendency due to extreme right-skewness. See Newman, supra note 23, at 325–27 (explaining conditions under which moments of power law distributions diverge); Clauset, Shalizi & Newman, supra note 33, at 662–65 (discussing instability of means and variances in heavy-tailed distributions); Gabaix, supra note 30, at 160–63 (noting that sample means in power law environments may fail to converge and are poor summaries of typical outcomes).
[37] In statistical analysis, “transformation” refers to applying a mathematical function to raw data in order to stabilize variance, reduce skewness, and mitigate the influence of extreme values. For heavily right-skewed data, such as citation counts, the natural logarithm is commonly used to compress large values while preserving relative ordering, thereby making the distribution more suitable for comparison and statistical modeling. See, e.g., Clauset, Shalizi & Newman, supra note 33, at 665–70.
[38]See Jeffrey M. Wooldridge, Introductory Econometrics: A Modern Approach 190–93 (6th ed. 2016) (describing log transformations as a standard response to skewed data); Hall, Jaffe & Trajtenberg, supra note 14, at 21–23 (using log-transformed citation counts in empirical patent valuation analysis).
[39] The natural logarithm is well suited for analyzing patent citation data because it reflects the way citations accumulate in practice. Patent citations do not grow linearly. Instead, they arise through cumulative and multiplicative processes: patents that are already visible are more likely to be discovered, relied upon, and cited again. This dynamic is often described as diffusion, cumulative advantage, or network effects and produces exponential growth for a small subset of patents while most receive few or no citations. The natural logarithm is specifically designed to model such behavior. By converting multiplicative growth into additive relationships, the logarithmic transformation compresses extreme values, reduces the dominance of outliers, and stabilizes variance across observations. In practical terms, this allows highly cited patents to remain distinguishable without overwhelming the analysis, while preserving meaningful differences among moderately cited patents. See Newman, surpa note 23, at 327–29 (explaining why logarithmic scales are appropriate for citation networks); Albert-László Barabási & Réka Albert, Emergence of Scaling in Random Networks, 286 Sci. 509, 511–12 (1999) (describing exponential growth and preferential attachment in network systems); Jaffe & Trajtenberg, supra note 18, at 24–30.
[40]See George E. P. Box & David R. Cox, An Analysis of Transformations, 26 J. Royal Stat. Soc’y Series B 211, 214–18 (1964) (explaining that log transformations reduce skewness and outlier effects); Wooldridge, supra note 39, at 190–93.
[41] Parametric statistical tools are analytical methods that rely on explicit assumptions about the underlying distribution of the data, most commonly that the data, or the model’s error terms, follow a normal (Gaussian) distribution. These tools summarize relationships using a limited set of parameters, such as a mean, variance, or regression coefficient, which describe the structure of the data. Common parametric techniques include ordinary least squares regression, t-tests, analysis of variance (ANOVA), and confidence-interval estimation. When their distributional assumptions are reasonably satisfied, parametric methods offer substantial advantages: they are computationally efficient, statistically powerful, and capable of producing interpretable estimates of magnitude, direction, and uncertainty. Because many real-world datasets, particularly those involving counts, financial values, or network activity and are highly skewed, transformations such as the natural logarithm are frequently applied to make the data more closely conform to parametric assumptions. Doing so enables researchers to employ these well-established statistical tools in a manner that is both methodologically sound and analytically transparent. See Box & Cox, supra note 41, at 214–19 (explaining that log transformations promote approximate normality); Wooldridge, supra note 39, at 190–93.
[42] Economic behavior is rarely driven by fixed unit changes; instead, decisions and outcomes typically respond to proportional variation. A doubling of revenue, a ten-percent increase in market share, or a twofold improvement in technological adoption carries economic meaning regardless of the baseline level. The natural logarithm reflects this reality by converting absolute differences into percentage-based relationships, ensuring that equal proportional changes receive equal analytical weight. In the context of patent citation analysis, the difference between ten and twenty citations conveys substantially more economic information than the difference between one hundred and one hundred ten, even though both represent an absolute increase of ten. Logarithmic transformation captures this distinction by compressing large values while preserving relative spacing, thereby aligning the analysis with how innovation diffuses, visibility compounds, and technological influence scales. As a result, natural log transformation produces measures that more accurately reflect economic significance, avoids overstating the importance of raw magnitude alone, and enables comparisons that are consistent with the proportional nature of value creation in innovation-driven markets.
[43]See Thomas M. Apostol, Calculus 213–14 (2d ed. 1967) (explaining that logarithmic functions are defined only for positive values); James Stewart, Calculus: Early Transcendentals 308–09 (8th ed. 2016).
[44] Because the logarithm of zero is undefined, empirical studies of patent citation data commonly apply a transformation of the form ln(C+1) to retain zero-citation patents while enabling logarithmic analysis. See Hall, Jaffe, & Trajtenberg, supra note 14, at 21–23 (employing log-transformed citation counts using a constant to accommodate zero observations); Jaffe & Trajtenberg, supra note 18, at 63–66 (discussing the treatment of zero-citation patents in citation-based empirical analysis); Wooldridge, supra note 39, at 191–93 (explaining that adding a small constant prior to log transformation is standard practice when datasets include zero values).
[45] Sabrina T. Howell et al., Revisiting the Private Value of Scientific Inventions (Nat’l Bureau of Econ. Rsch. Working Paper, No. 33056).
[46] Because citation counts are non-negative and frequently include zero observations, empirical studies commonly employ a ln (C + 1) transformation rather than ln (C) in order to retain uncited patents and avoid truncation of the sample. See, e.g., Hall, Jaffe & Trajtenberg, supra note 14, at 20–23 (using log (1 + citations) in regressions and noting the highly skewed distribution with a mass at zero); Harhoff et al., supra note 17, at 513–14 (discussing the skewed distribution of citations and the presence of zero counts); Wesley M. Cohen, Richard R. Nelson & John P. Walsh, Protecting Their Intellectual Assets 26–27 (Nat’l Bureau of Econ. Rsch. Working Paper, No.7552) (employing log (1 + citations) in empirical specifications); see also Wooldridge, supra note 37, at 191–93 (explaining that adding a constant before logging count variables preserves zero observations and avoids dropping data from the sample).
[47] The use of the transformation ln (C+1) rather than ln (C), is standard in empirical patent analysis and serves substantive analytical purposes beyond resolving the mathematical undefinedness of the logarithm at zero. Excluding zero-citation patents can introduce selection bias by disproportionately removing low-visibility or early-stage inventions from the sample, particularly where analysis requires comparison across complete patent portfolios. See Hall et al., supra note 12, at 21–23 (using ln (C) to retain uncited patents in valuation analysis); Jaffe & Trajtenberg, supra note 18, at 63–66 (explaining the prevalence of zero-citation patents and the importance of maintaining complete samples); Harhoff et al., supra note 17, at 514–15 (emphasizing that truncation of citation data can distort inference); Wooldridge, supra note 37, at 191–93 (noting that adding a constant prior to log transformation preserves observations and avoids discontinuities at low values); Box & Cox, supra note 34, at 214–18 (discussing continuity and proportional scaling properties of logarithmic transformations).
[48] Note how the increase in value diminishes as citations rise. This mirrors the intuition that early citations matter more than later ones, both in perception and in economic impact.
[49] Although logarithmic transformation addresses skewness and scale, it does not by itself account for structural differences across technology classes, filing periods, or citation windows that affect baseline citation levels. Standardization using z-scores is therefore commonly employed to facilitate meaningful comparison across heterogeneous groups by expressing each observation relative to the mean and dispersion of its peer cohort. See Hall, Jaffe & Trajtenberg, supra note 14, at 16, 19–23 (2005) (noting systematic differences in citation behavior across technologies and time); Jaffe & Trajtenberg, supra note 18, at63–70 (2002) (discussing cohort effects and the need for normalization); Harhoff et al., supra note 17, at 514–15 (explaining that raw and log-transformed citation counts must be interpreted relative to field and age); William H. Greene, Econometric Analysis 55–57 (8th ed. 2018) (defining z-score standardization as transforming variables to deviations from the mean measured in standard-deviation units); Wooldridge, supra note 37, at 63–64 (describing standardized variables as tools for cross-group comparability).
[50]See David S. Moore, George P. McCabe & Bruce A. Craig, Introduction to the Practice of Statistics 59–60 (9th ed. 2016) (setting forth the z-score formula z = (x – µ)/σ)); Greene, supra note 50, at 55–57.
[51] Cohorts of patents must be carefully selected and defined when performing patent citation analysis because citation behavior is not uniform across the patent system. The likelihood that a patent will be cited is shaped by structural characteristics that vary systematically across technologies, time periods, and institutional practices. Patents in rapidly evolving fields tend to accumulate citations more quickly than those in mature or niche technologies. Older patents have had more time to be discovered and cited than newer ones, while examination practices and citation norms differ across art units and filing eras. As a result, raw citation counts, even when log transformed, are not directly comparable across heterogeneous populations.
[52] Empirical patent citation studies commonly define peer cohorts using shared characteristics that influence citation opportunity, including technology classification systems (such as CPC, IPC, or USPC codes), filing or grant year, jurisdiction of examination, and applicant or entity size. See Jaffe & Trajtenberg, supra note 18, at, 63–70 (discussing cohort normalization by technology class and application year); Hall, Jaffe & Trajtenberg, supra note 14, at 19–23 (normalizing citation measures by technology field and age); Mariagrazia Squicciarini, Hélène Dernis & Chiara Criscuolo, Measuring Patent Quality: Indicators of Tech. and Econ. Value, OECD SCI., TECH. & INDUS. WORKING PAPERS NO. 2012/03 1, 9–15 (2013) (describing citation-based indicators normalized by technology, filing year, jurisdiction, and applicant characteristics) (describing citation-based indicators normalized by technology, filing year, jurisdiction, and applicant characteristics); Stuart J. H. Graham et al., High Technology Entrepreneurs and the Patent System, 24 Berkeley Tech. L.J. 1255, 1276–77 (2009) (noting systematic citation differences between large firms and small or individual patentees).
[53] The interpretive meaning of a z-score in patent citation analysis is inseparable from the cohort against which it is calculated. A z-score does not measure technological importance in absolute terms; rather, it measures how a patent performs relative to the distribution of citations within a defined peer group. Because citation behavior varies systematically across technologies, time periods, and institutional environments, the same patent can yield materially different z-scores depending on the cohort selected.
[54]See Greene, supra note 50, at 55–57 (discussing standardized variables for ranking and benchmarking); Squicciarini, Dernis & Criscuolo, supra note 53, at 9–15 (using standardized citation indicators for patent benchmarking and portfolio comparison) (using standardized citation indicators for patent benchmarking and portfolio comparison).
[55] Because z-scores are linear standardizations of the form z=(-µ)/σ, adding a constant to all observations constitutes a simple affine transformation that preserves relative ordering, dispersion, and statistical inference while altering only the location parameter. See, e.g., George Casella & Roger L. Berger, Statistical Inference 27–30 (2d ed. 2002) (explaining that linear transformations shift the mean without affecting variance structure); Larry V. Hedges & Ingram Olkin, Statistical Methods for Meta-Analysis 80–83 (1985) (noting that standardized effect sizes may be rescaled or shifted for interpretability without altering comparative properties); Am. Ed. Rsch. Ass'n. et al., Standards for Educational and Psychological Testing 27–29 (2014) (recognizing that standardized scores are often linearly transformed to avoid negative values or to facilitate communication). In applied settings, upward shifts (e.g., adding a constant such as 3.0 or 3.5) are frequently used to eliminate negative values and improve presentation while leaving cross-sectional comparisons unchanged.
[56] Although z-scores are conventionally centered at zero, applying a uniform upward shift preserves relative rankings and distances while eliminating negative values that lack economic meaning in valuation and apportionment contexts. Because the transformation is linear, it does not affect statistical relationships, but facilitates proportional weighting, portfolio allocation, and clearer communication. See Greene, supra note 50, at 55–57 (explaining that standardized variables may be linearly rescaled without altering inference); Wooldridge, supra note 37, at 63–65 (noting that linear transformations preserve relative relationships).
[57] A z-score is defined as z=(-μ)/σ, where is an observation, μ is the sample or population mean, and σ is the standard deviation; it represents the number of standard deviations an observation lies above or below the mean. See, e.g., Casella & Berger, supra note 56, at 25–27; Larry Wasserman, All of Statistics: A Concise Course in Statistical Inference17–19, 28 (defining standardization and z-scores as linear transformations that center data at zero and scale by the standard deviation); David Freedman, Robert Pisani & Roger Purves, Statistics 203–05 (4th ed. 2007) (explaining the interpretation of standardized values as deviations from the mean measured in standard deviation units).
[58]See David S. Moore et al., supra note 51, at 59–60 (9th ed. 2016) (defining z-scores); Sheldon M. Ross, Introduction to Probability Models 137–39 (11th ed. 2014) (noting that nearly all values in a normal distribution lie within plus or minus 3.5 standard deviations).
[59]See Figure 4.
[60] See Figure 3.
[61] Research in behavioral decision theory and financial communication shows that numerical framing and presentation materially influence interpretation, particularly among non-technical audiences. See, e.g., Daniel Kahneman & Amos Tversky, Prospect Theory: An Analysis of Decision Under Risk, 47 Econometrica 263, 273–79 (1979) (demonstrating that framing effects alter evaluation of gains and losses); Amos Tversky & Daniel Kahneman, The Framing of Decisions and the Psychology of Choice, 211 Sci. 453, 453–58 (1981) (showing that equivalent information presented differently can produce systematically different judgments); Chip Heath & Karla Star, Making Numbers Count: The Art and Science of Communicating Numbers 18–27 (2014) (discussing how numerical presentation affects perceived meaning and credibility); see also George A. Miller, The Magical Number Seven, Plus or Minus Two, 63 Psychol. Rev. 81, 90–93 (1956) (explaining limits on cognitive processing relevant to numerical interpretation). In applied financial reporting contexts, presentation formats that reduce ambiguity and cognitive burden are commonly preferred when communicating quantitative results to non-specialist stakeholders.
[62]See Georgia-Pacific Corp.,318 F. Supp. at 1120–21.
[63]See id.; see alsoLucent Techs., Inc., 580 F.3d at 1324–25.
[64]SeeGeorgia-Pacific Corp., 318 F. Supp. at 1120 (listing factors including licensing practices, commercial relationships, and the advantages of the patented invention over prior art).
[65] See, e.g., Exmark Mfg. Co. v. Briggs & Stratton Power Prods. Grp., LLC, 879 F.3d 1332, 1348–49 (Fed. Cir. 2018) (reaffirming use of Georgia-Pacific framework in reasonable royalty analysis); see also Christopher B. Seaman, Reconsidering the Georgia-Pacific Standard for Reasonable Royalty Patent Damages, 2010 BYU L. Rev. 1661, 1661 (2017).
[66]Georgia-Pacific Corp., 318 F. Supp. at 1120–21 (identifying as factor 9 “the utility and advantages of the patent property over the old modes or devices, if any, that had been used for working out similar results”).
[67]Georgia-Pacific Corp., 318 F. Supp. at 1120–21 (identifying as factor 13 “The portion of the realizable profit that should be credited to the invention as distinguished from non-patented elements, the manufacturing process, business risks, or significant features or improvements added by the infringer.”)
[68]Georgia-Pacific Corp., 318 F. Supp. at 1120–21.
[69]Georgia-Pacific Corp., 318 F. Supp. at 1120–21 (identifying as factor 15 “[t]he amount that a licensor … and a licensee … would have agreed upon … if both had been reasonably and voluntarily trying to reach an agreement,”)
[70]SeeGeorgia-Pacific Corp., 318 F. Supp. at 1120–21.
[71] Patent citation analysis can play an important supporting role in comparability assessments in licensing and benchmarking exercises by providing an objective, technology-based framework for evaluating relative patent significance. Licensing disputes frequently turn on whether purported comparables, such as prior licenses, portfolio transactions, or asserted benchmarks, reflect technologies of similar importance, scope, and economic contribution. Patent citation analysis assists in this inquiry by measuring how patents are situated within the broader innovation landscape, using citation behavior as evidence of technological visibility, reliance, and influence.
[72] Federal Rule of Evidence 702 requires that expert testimony be based on sufficient facts or data and reliable principles and methods reliably applied. Fed. R. Evid. 702.
[73]See Fed. R. Evid. 702; Daubert v. Merrell Dow Pharms., Inc., 509 U.S. 579, 589–95 (1993); Kumho Tire Co. v. Carmichael, 526 U.S. 137, 147–49 (1999). Patent citation analysis aligns with these requirements because it relies on publicly observable, independently generated patent records; employs testable and peer-reviewed economic methodologies; and applies transparent statistical techniques capable of replication. See, e.g., Hall, Trajtenberg & Henderson, supra note 18; Hall, Jaffe & Trajtenberg, supra note 14. By grounding opinions in objective data rather than subjective judgment, citation-based analysis can assist experts in demonstrating reliability and avoiding ipse dixit concerns under Rule 702. SeeGen. Elec. Co. v. Joiner, 522 U.S. 136, 146 (1997).
[74] The International Patent Classification (IPC) system is a hierarchical taxonomy administered by the World Intellectual Property Organization (WIPO) that classifies patents according to the technical subject matter of the claimed invention. IPC codes are organized into sections, classes, subclasses, and groups, and are used internationally to facilitate patent searching, examination, and comparative technological analysis. See WIPO, International Patent Classification (IPC), https://www.wipo.int/classifications/ipc/en/ (last visited Mar. 8. 2025).
[75] The implied royalty rate is calculated by dividing the allocated dollar value for each patent by the total licensed revenue. For example, $336,000/ $20m = 0.0168, or 1.68%. Similarly, $21,000/$20m=0.00105, or 0.105%.
[76] Fed. R. Evid. 702; seeEcoFactor, Inc. v. Google LLC, No. 23-1101 (Fed. Cir. May 21, 2025) (en banc).
[77] Courts evaluating expert testimony require methodologies that are transparent, testable, and capable of replication. See Fed. R. Evid. 702; Daubert, 509 U.S. at 589–95; Kumho Tire Co., 526 U.S. at 147–49. Patent citation analysis, when properly normalized and grounded in accepted statistical techniques, satisfies these requirements by relying on independently generated patent records and peer-reviewed economic methods. See, e.g., Jaffe, Trajtenberg & Henderson, supra note 18; Hall, Jaffe & Trajtenberg, supra note 14. Such analysis can also inform reasonable-royalty determinations by providing objective evidence relevant to technological importance, apportionment, and hypothetical-negotiation considerations under Georgia-Pacific Corp., 318 F. Supp. at 1120.